How to Leverage Data Visualisation For Social Media
According to digital experts, utilizing data visualization animations can significantly boost social media engagement. Although it might seem complex at first, our team has created a quick guide on how to effectively leverage data visualization for social media using the Flourish platform.
What is Data Visualization?
Data visualization involves converting data into visual representations, such as charts, graphs, and infographics, to enhance its accessibility and comprehension. This process simplifies complex data, allowing businesses to uncover insights and detect patterns that might remain concealed within raw numerical data.
Numerous data visualization tools are at your disposal, each suited for different tasks depending on the unique dataset and objectives. In our experience, we have found Flourish to be particularly valuable, especially when crafting content for social media.
How to Create a Data Visualisation For Social Media

Choosing Your Data
The first step in creating a data visualization is selecting the data that you want to present. It’s crucial to choose data that is relevant to your audience and message. Data can come from various sources, such as surveys, government reports, or your own research.
To start, identify your goals and determine the story you want to tell with the data. Think about the key points you want to highlight and the message you want to convey.
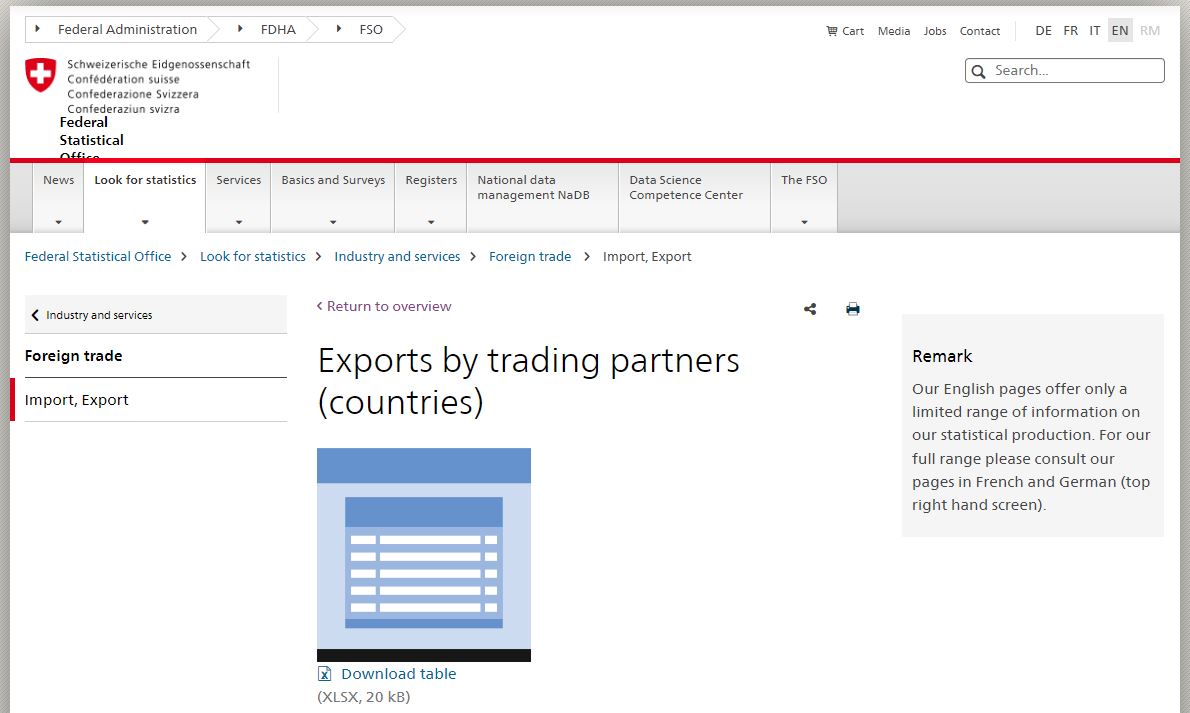
Our Source:
Exports by trading partners (countries), Federal Statistical Office

Choosing the Right Visualization Type
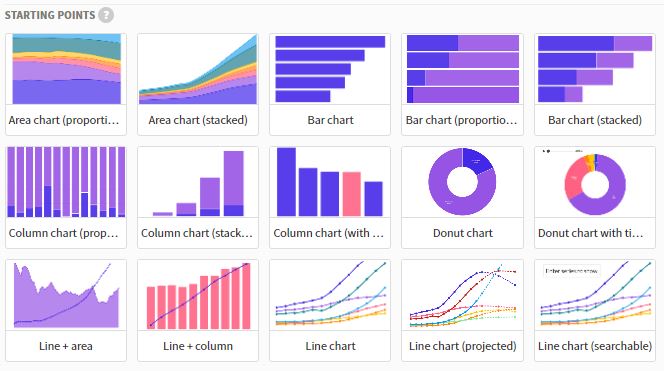
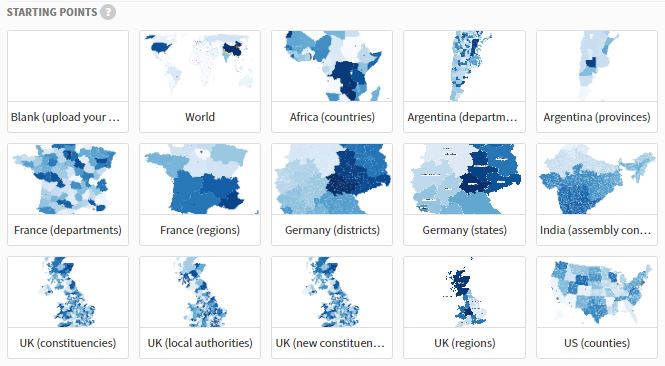
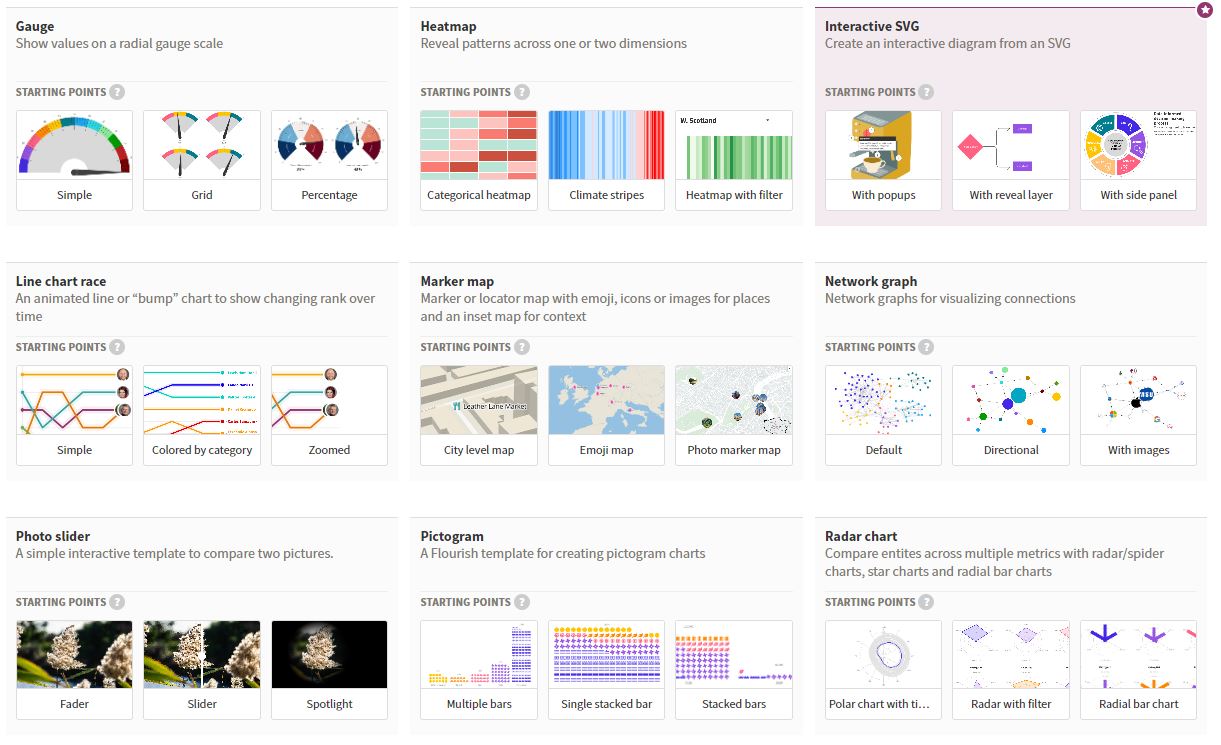
Selecting the appropriate visualization type is crucial. There are various options, such as bar charts, pie charts, line graphs, and scatter plots. Your choice should align with your data and the story you want to tell. For instance, use a bar chart for comparing categories, a line graph for showing trends over time, and a pie chart for illustrating part-to-whole relationships.

Data Cleaning and Preparation
Once you’ve gathered your data, it’s time to clean and prepare it. Data cleaning involves removing any errors, outliers, or inconsistencies that could distort your visualisation. This step ensures the accuracy of your visual representation.
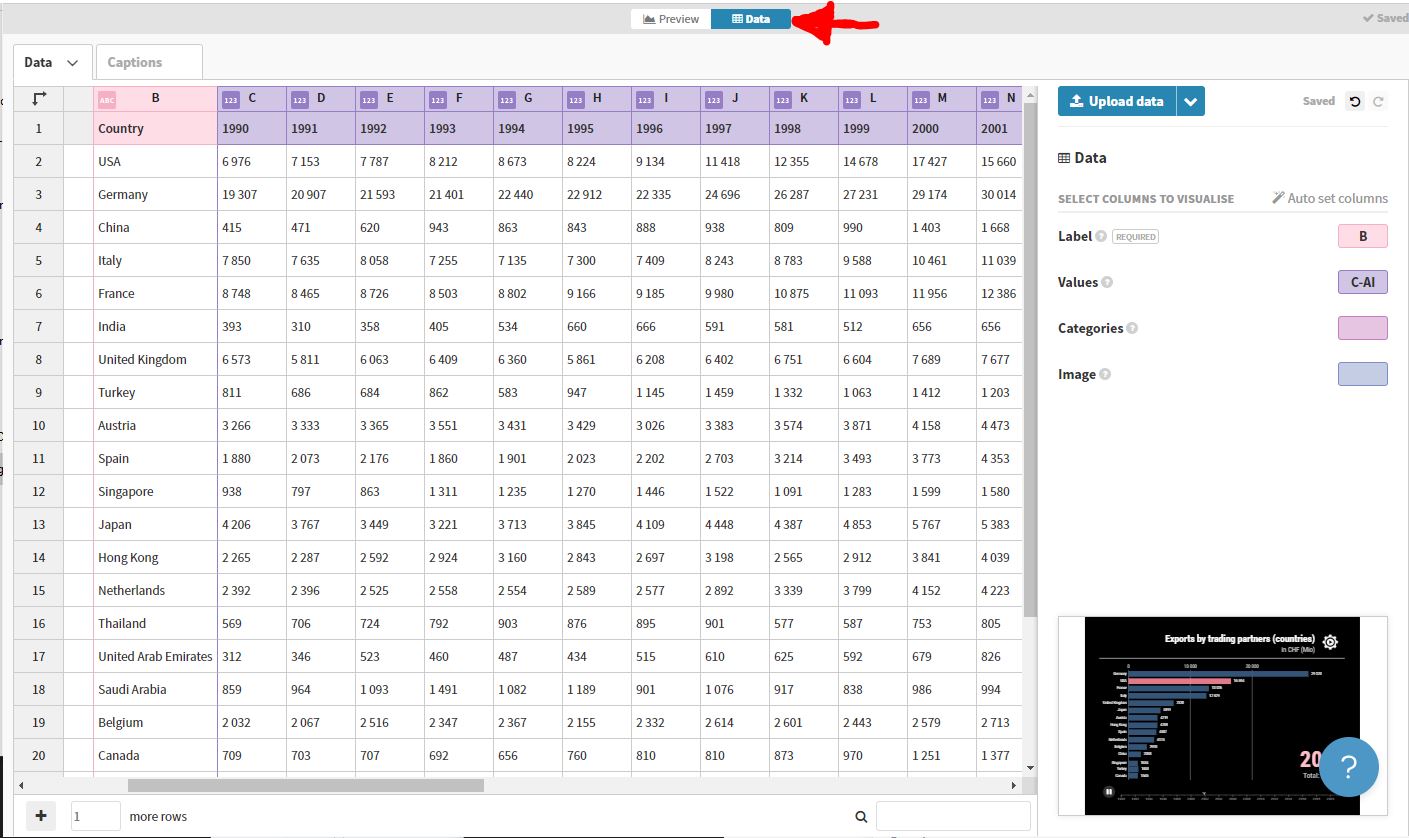
Next, organize your data into a format suitable for visualization. This may involve structuring it in spreadsheets or data visualization software. Make sure your data is well-labeled, as clear labels are essential for understanding your visualizations.
By clicking on the “data” tab, you can upload and amend data easily.

Configure The Data Visualisation
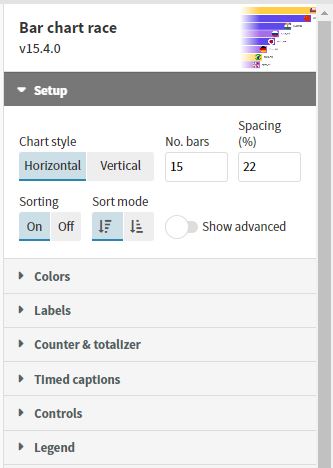
Now, it’s time to create the actual visualization. Remember to keep it simple and uncluttered, as complex visuals can be overwhelming for your audience. Ensure that your visualization is easy to understand, even for those who may not be familiar with the topic.
Your data visualization should be self-explanatory to some extent, but it’s essential to provide context and explanations. Don’t forget to add essential items such as the title, labels and references.

Designing for Social Media
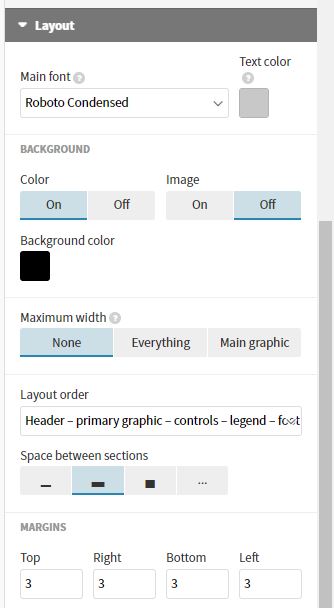
When creating a data visualization for social media, consider the platform’s specifications. Different platforms may have varying image size and resolution requirements. Ensure your visualization looks good on both desktop and mobile devices.
Use eye-catching visuals, but avoid clutter. Incorporate relevant icons or images that enhance the message. Make sure the text is legible and not too small. Use a consistent color scheme, and avoid using too many colors.

Export, Test & Publish
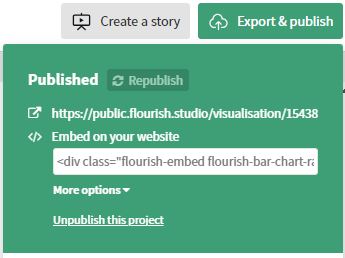
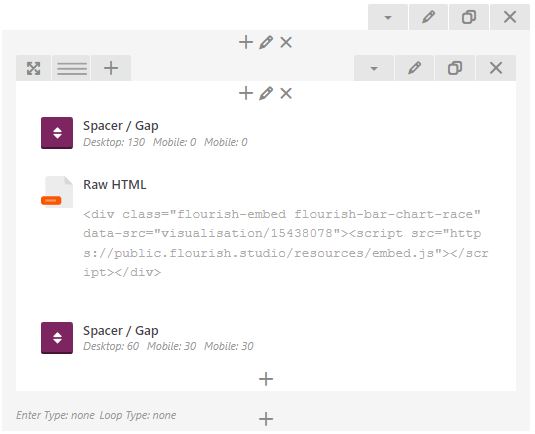
When you wish to share your animation on your social media platforms, you have several options available. In the freemium version, you can generate a link, which you can share with your peers or incorporate into your presentations. Alternatively, if you’d like to display it on your website, you can embed a piece of code.
Before you proceed with publication, it’s a good practice to share it with one of your colleagues. Taking a moment for a quick validation process is always a wise step. The entire process of creating a data visualisation for social media typically takes one to two hours, including data gathering and cleaning. Don’t hesitate to seek a second opinion before you kick off the publishing process.
